Photograph as originally submitted to
this page in the Historical Marker Database
www.HMdb.org.
Click on photo to resize in browser. Scroll down to see metadata.
Photographer: Courtesy of the Great Lakes Integrated Sciences and Assessments
Caption:
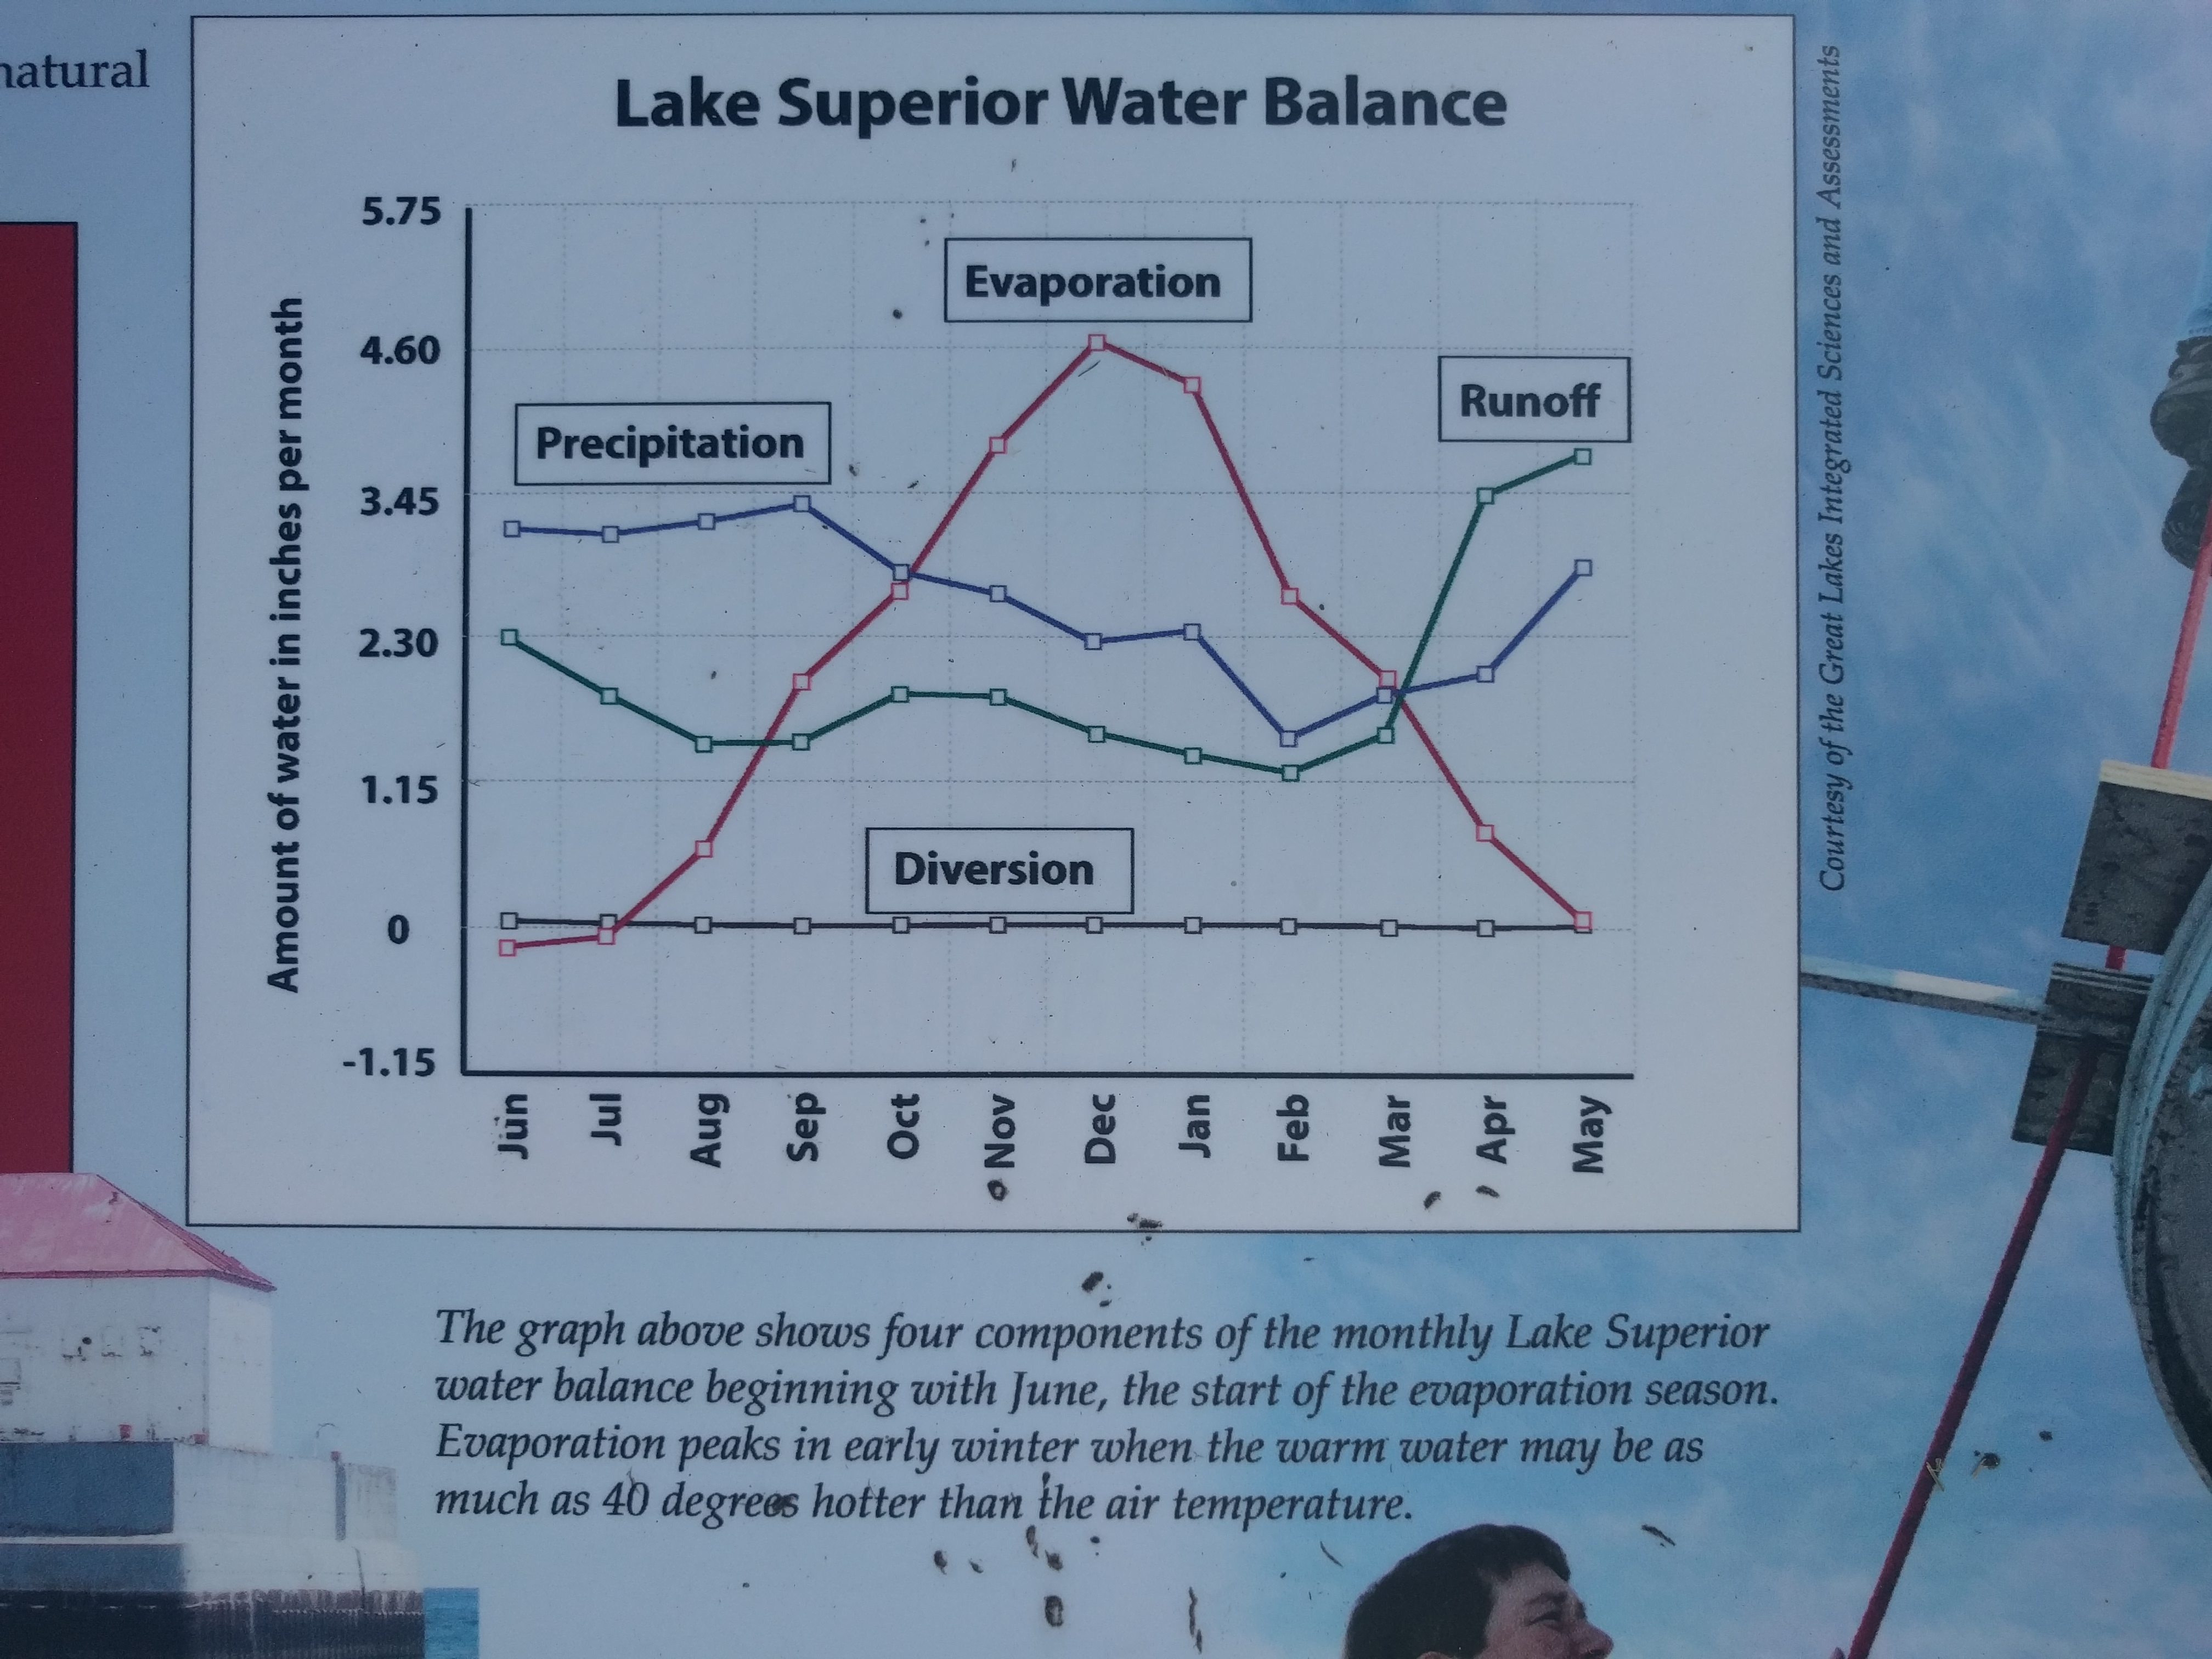
Lake Level Research on the Great Lakes Marker - graph | Additional Description: The graph above shows four components of the monthly Lake Superior water balance beginning with June, the start of the evaporation season. Evaporation peaks in early winter when the warm water may be as much as 40 degrees hotter than the air temperature.
Submitted: October 10, 2019, by Joel Seewald of Madison Heights, Michigan.
Database Locator Identification Number: p497265
File Size: 2.513 Megabytes
To see the metadata that may be embedded in this photo, sign in and then return to this page.